Jobs, quota, and setup alerts
You may want to check the jobs teammate submitted to ensure they are reasonably leveraging your resources. This article covers how you check jobs, how the quota system works, and how we can set up alerts to let the system monitor for you.
Check running, queuing, and completed jobs
Job owners can inspect their jobs through the top-right corner dropdown. On the other hand, an account owner can review every member's jobs on the account page. So, click the account name you want to check from the Accounts page. Then, in the overview sub-page, you will see links to inspect jobs. Finally, click either running or completed jobs to open the jobs window.
In the running tab, you see jobs currently running under the selected account, their requester, the partition, the duration, and the per-job real-time CPU or memory utilization. You may cancel any job by clicking the cancel button.
In the queuing tab, you see jobs currently waiting inside queues, the partition they are in, and the requested CPU or memory. You may cancel or change its priority.
In the completed tab, there are jobs already completed or failed. Click the job ID to view the detailed charge and utilization status.
If you want to sort them by CPU or memory utilization, you may click the gear button at the top-right corner to toggle the columns of the table.
Setup alerts about utilization
To spot under-utilized jobs, we may inspect jobs on the portal in real time. But the system also provided a way to monitor it automatically. Switch to the settings tab on the account page, and you will see a job efficiency monitor section.
By default, the system notifies the owner if their job is using below 50% of either CPU or memory. The system will not count the first 10 minutes because we assume the application is warming up. You may play around with the settings for your need.
How quota works
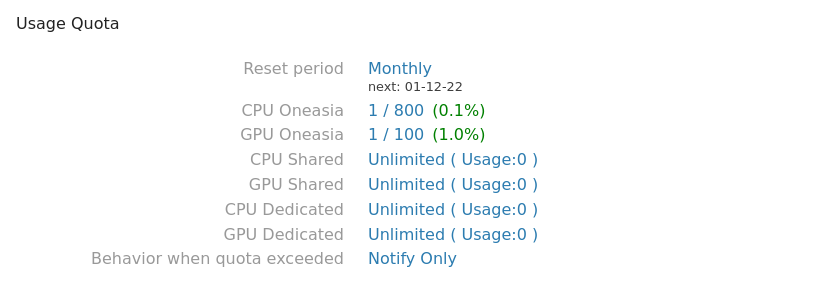
OAsis uses our quota system, which is different from a typical SLURM setting. It allows six meters setting instead of a combined total number.
- CPU Oneasia
- GPU Oneasia
- CPU Shared
- GPU Shared
- CPU Dedicated
- GPU Dedicated
As their names tell, they are referring to CPU and GPU usage over 3 node pools. The unit of CPU usage is the number of hours spent on one AMD EPYC 7713 core. On the other hand, the number of hours spent on one NVIDIA A100 GPU card.
Quota is applied on the account (group) level and considers not just your account quota but every upper-level account. For example, an institute may have 1,000 units of "GPU Oneasia" evenly distributed to 4 departments. And the departments can assign them to each project group. The system only accepts jobs when all levels (institute, department, project group) have enough quota.
The system supports a custom reset period per account. You may choose from weekly, monthly, quarterly, and yearly.
Check current usage and my quota
You may check them through the web portal on the accounts page.
You may also check them through the CLI client as the following:
$ hc quotas
# Account   | CPU/Mem Oneasia   | CPU/Mem Shared    | GPU Shared        | CPU/Mem Dedicated | GPU Oneasia       | GPU Dedicated
# appcara   | 0.2 / 800         | 0.0               | 0.0               | 0.0               | 0.0 / 100         | 0.0

# of if you prefer a JSON format
$ hc quotas -o json
# [
#  {
#    "account_id": "appcara",
#    "quota": {
#      "oneasia_csu": 800.0,
#      "oneasia_gsu": 100.0
#    },
#    "usage": {
#      "dedicated_csu": 0.0,
#      "dedicated_gsu": 0.0,
#      "oneasia_gsu": 0.047666665,
#      "shared_csu": 0.0,
#      "shared_gsu": 0.0,
#      "oneasia_csu": 0.16666667
#    }
#  }
# ]
Set quota and auto alerts
If your upper-level account empowered you to modify quotas, you could do this on the account settings page.
You may change the "Behavior when quota exceeded" from "Notify Only" to "Auto kill jobs" if you want a hard quota limit.


