Fine tune your workload
The web portal provides data for you to understand the actual utilization of your jobs, running or completed.
When you have a job running, click jobs, then the running jobs from the top menu bar to see the below screen. This screen tells the duration and consumption/allocation status of memory and CPU. If your job is underutilized, you may consider canceling it by clicking the cancel link on this screen and re-running it with a lower setting.
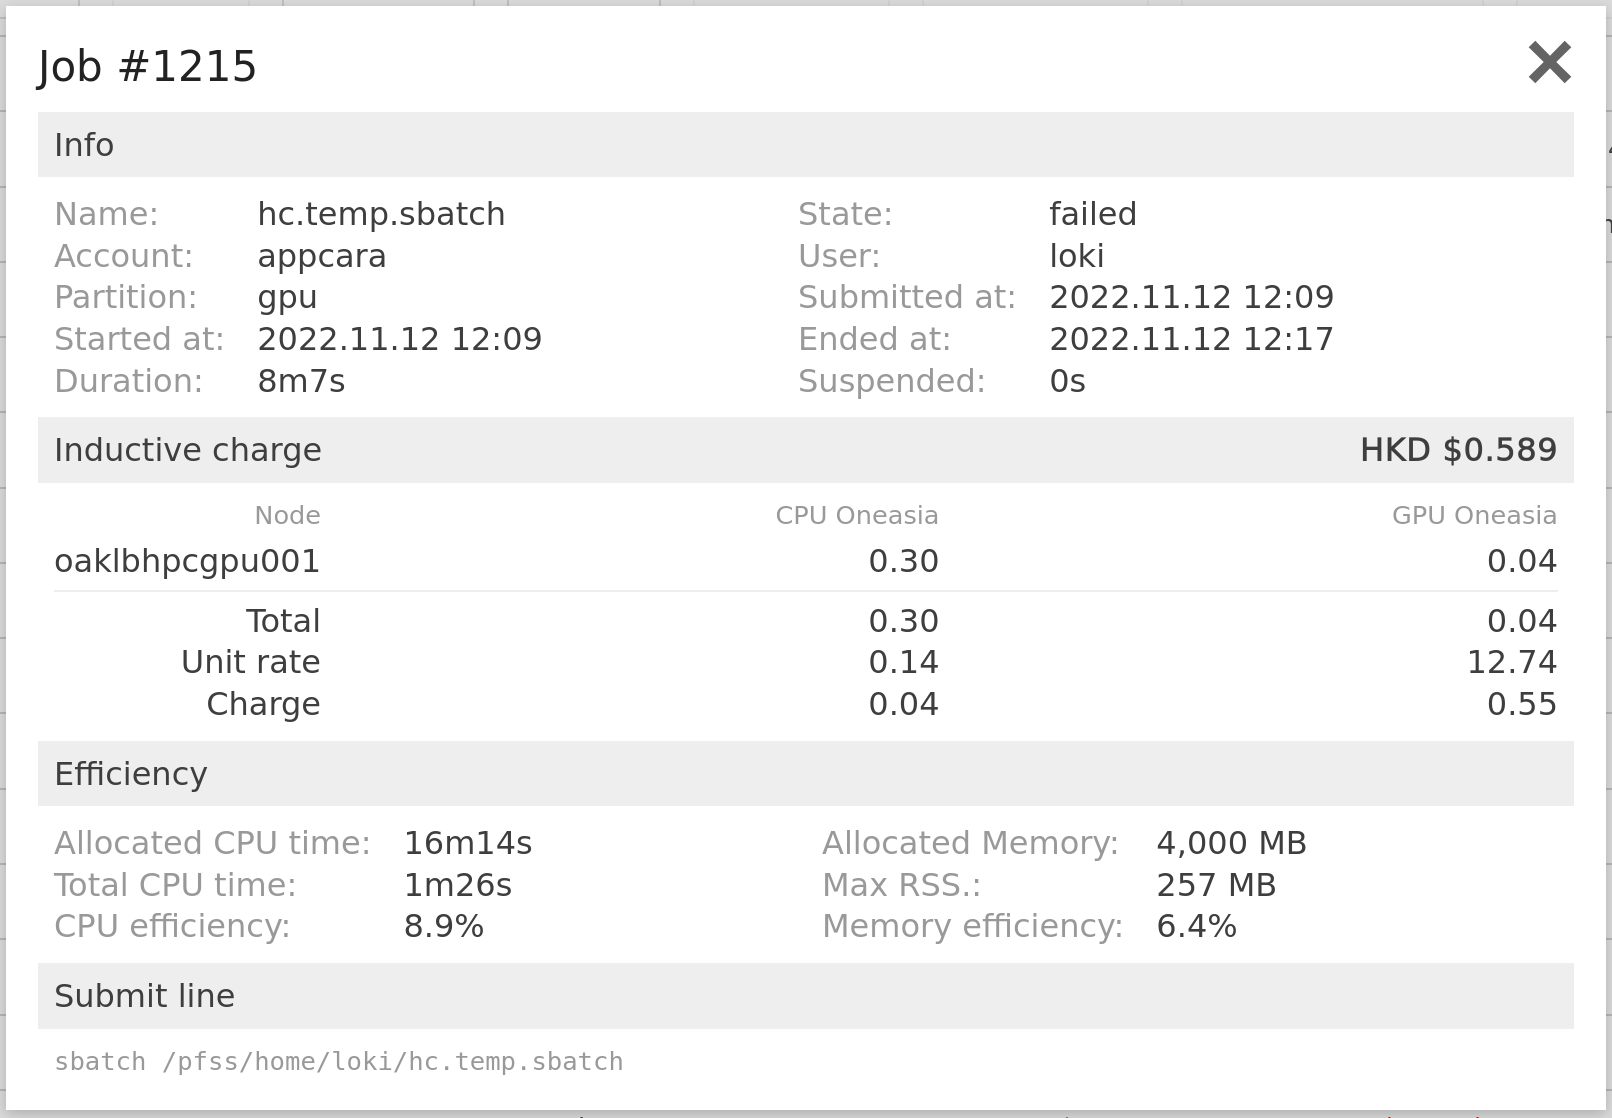
After a job is completed, you may want to understand the utilization. Open the completed jobs window, search and click on the job id to bring up the below details window. In the efficiency section, you can find the allocated CPU time and memory, with the actual consumed figures.
There is also an inductive charge section. Telling what nodes have been allocated to this job and how much the charge is. Here is the standard cost, but not including the tiered price and discount.
To analyze the GPU utilization status of your job, you may want to profile your application. The cluster has both NVIDIA Visual Profiler and Nsight Compute installed. We provide them in both Lmod and through the NVHPC container. Please check them out if needed.

